
In this week’s coverage, we analyze the rally in the Micro Nasdaq, gasoline, and gold futures, and the continued decline in the 10-year note futures. We also examine the economic reports and earnings announcements expected next week.
Commentary and charts reflect data at the time of writing (Thursday, April 24 at 5 PM ET), and market conditions may change by the publication of this analysis.
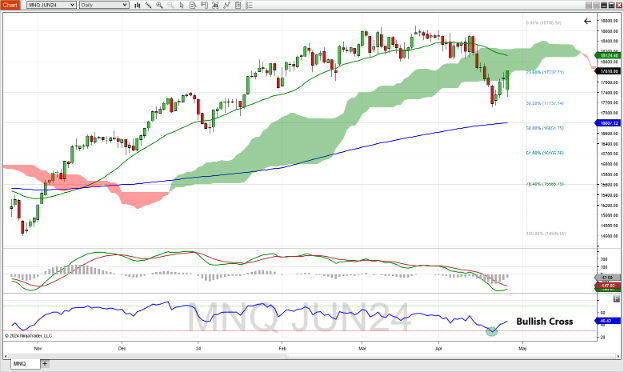
June Micro Nasdaq 100 Index Futures Daily Chart
June Micro Nasdaq 100 Index futures got a bit of a bid last week, rallying into the bottom of the Ichimoku cloud. Expect Nasdaq futures to experience a slow in its roll as it tries to get out of the cloud to the upside. This coincides with the 23.6% Fibonacci retracement level after testing the 38.2% Fib level the prior week. Nasdaq is trading between the 26-day and 200-day moving averages. The MACD histogram is setting up to cross above 0 while the MACD is negative, which could indicate the first step in the resumption of an uptrend. RSI showed a bullish cross two weeks ago, and the trend has been up since. Should the rally continue, expect resistance at the top of the Ichimoku cloud (~18,250). Support might be found at the 200-day moving average (~16,825), which held as support the last time it was tested (October 2023).
 June Micro Nasdaq 100 Index futures daily chart
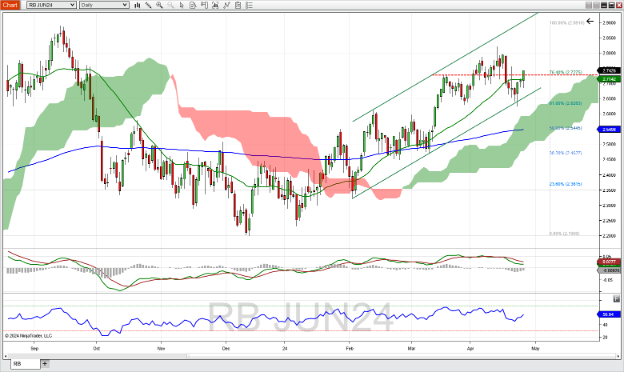
June Gasoline Futures Daily Chart
June gasoline futures rallied after testing the lower end of a trend channel that's been in effect since the beginning of the year. This resulted in a cross above the 26-day moving average as well as a support and resistance line at ~2.73. Price is trading above its 200-day moving average and a bullish-looking Ichimoku cloud. The MACD histogram looks poised to cross above the zero line, which would be a bullish indication. RSI is trending up with price and still has room to go to get to the overbought level of 70. If the market continues to rally, look for some resistance at the recent high of 2.8226. There's plenty of support to be found if this market does weaken and fall--the bottom of the trend channel (~2.67), the top of the Ichimoku cloud (~2.59), and the 200-day moving average (~2.55).
 June gasoline futures daily chart
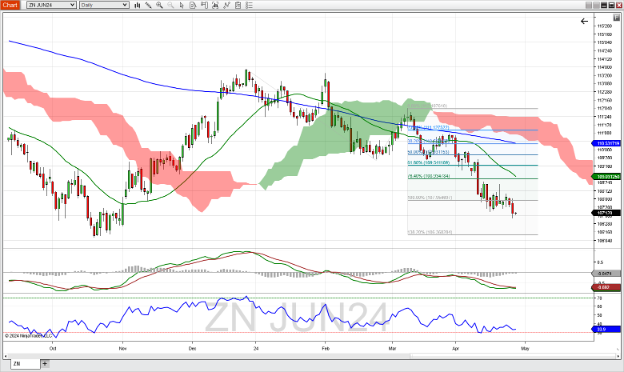
June 10-Year Note Futures Daily Chart
June 10-year note futures continued their descent as they finally broke clear of the 100% Fibonacci extension that measures the previous downtrend, which started in December of last year and ended at the end of February. Price is well below the 26- and 200-day moving averages and continues to trend below the Ichimoku cloud. The MACD histogram looked like it was about to turn positive but backed off near the end of the week; a cross above 0 could be the start of a bullish turn around. RSI is nearing the oversold level of 30, which reflects bearish price action. If this market continues to trend downward, support might be found at the 138% Fibonacci extension level, which coincides with the low from October last year (~106’11). A rally could find resistance at the 76.4% Fib extension level, which is reinforced by the 26-day moving average (~108’31).
 June 10-year note futures daily chart
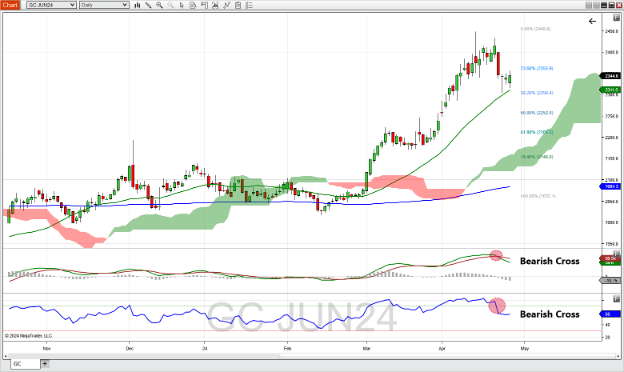
June Gold Futures Daily Chart
June gold futures experienced consolidation last week after the previous week’s big sell off. The 26-day moving average held as support all week, as did the 38.2% Fibonacci retracement level (found by measuring the previous bullish move which began at the end of February). Both the RSI and MACD got a bearish cross signal with the dominant candle sell-off, but last week’s follow-through seemed to plateau mid-week. Should this rally hold, resistance might be found at the 23.6% Fib level (~23.55) while support might be found at the 38.2% Fib level (~2298) and the 50% Fib level (2252).
 June gold futures daily chart
Companies Reporting Earnings April 29 – May 3
Two of the “Magnificent 7” stocks report earnings after markets close next week: Amazon on Tuesday and Apple on Thursday. If last week’s Meta (Facebook) earnings event was any guide, Nasdaq could show some volatility even if earnings and revenue are in line.
Four other Dow stocks in addition to Apple report this week: 3M, McDonald's, and Coca-Cola on Tuesday morning and Amgen on Thursday afternoon. This could inject volatility in YM and MYM futures. Healthcare and pharmaceuticals are represented by Eli Lilly, Pfizer, CVS Health, and Moderna.
Other tech companies reporting are eBay and PayPal. The insurance sector is represented by Allstate, AIG, MetLife, and Cigna. Oil companies start reporting with Marathon Oil on Wednesday and ConocoPhillips on Thursday. Information about the crude oil market outlook might be made evident on those earnings calls.
| Date | Companies Earnings |
|---|---|
| Monday, April 29 | N/A |
| Tuesday, April 30 | PayPal (PYPL): $1.24 EPS Estimate, $7.50B Revenue Estimate (BMO) Eli Lilly & Co. (LLY): $2.53 EPS Estimate, $8.81B Revenue Estimate (BMO) 3M Company (MMM): $01.93 EPS Estimate, $7.64B Revenue Estimate (BMO) * McDonalds Corp. (MCD): $2.70 EPS Estimate, $6.17B Revenue Estimate (BMO) * Coca-Cola Company (KO): $0.69 EPS Estimate, $10.95B Revenue Estimate (BMO) * Archer-Daniels-Midland Co. (ADM): $1.35 EPS Estimate, $22.30B Revenue Estimate (BMO) Amazon.com, Inc. (AMZN): $0.82 EPS Estimate, $142.48B Revenue Estimate (AMC) Advanced Micro Devices, Inc. (AMD): $0.61 EPS Estimate, $5.42B Revenue Estimate (AMC) |
| Wednesday, May 1 | Pfizer Inc. (PFE): $0.56 EPS Estimate, $13.86B Revenue Estimate (BMO) CVS Health (CVS): $1.69 EPS Estimate, $89.23B Revenue Estimate (BMO) Allstate Corp. (ALL): $3.88 EPS Estimate, $15.29B Revenue Estimate (AMC) eBay, Inc. (EBAY): $0.97 EPS Estimate, $2.53B Revenue Estimate (AMC) American International Group, Inc. (AIG): $1.68 EPS Estimate, $12.04B Revenue Estimate (AMC) Metlife Inc. (MET): $1.83 EPS Estimate, $17.78B Revenue Estimate (AMC) MGM Resorts International (MGM): $0.60 EPS Estimate, $4.15B Revenue Estimate (AMC) Marathon Oil Corp. (MRO): $0.53 EPS Estimate, $1.58B Revenue Estimate (AMC) |
| Thursday, May 2 | Moderna, Inc. (MRNA): $-3.59 EPS Estimate, $288.77B Revenue Estimate (BMO) ConocoPhillips (COP): $2.09 EPS Estimate, $14.79B Revenue Estimate (BMO) Cigna Corp. (CI): $6.17 EPS Estimate, $56.64B Revenue Estimate (BMO) Apple, Inc. (AAPL): $1.51 EPS Estimate, $89.79B Revenue Estimate (AMC) * Amgen, Inc. (AMGN): $3.76 EPS Estimate, $7.39B Revenue Estimate (AMC) * U.S. Steel (X): $0.77 EPS Estimate, $4.20B Revenue Estimate (AMC) |
| Friday, May 3 | N/A |
* indicates that this company is in the Dow Jones Index
Economic Reports for the week of April 29 – May 3
The main event this week will be the FOMC meeting that starts Tuesday morning, which communicates in an announcement at 2:00 PM on Wednesday followed by a press conference by chair Powell on at 2:30. Coincidentally, next week also sees multiple reports from the labor sector, which is half of the dual mandate that the Fed is tasked with (the other being inflation mitigation).
The employment situation Friday morning could be more significant than Jobless Claims the day before. ADP Employment and the JOLTS report both arrive Wednesday morning, followed by the Challenger Job Cut report early Thursday morning. The housing market gets information Tuesday morning as well with both the FHFA and Case Shiller Price reports.
Manufacturing reports include Dallas Fed Manufacturing Monday morning at 8:30, PMI and ISM Manufacturing at 9:45 and 10:00 AM, respectively. On Wednesday, Factory Orders Thursday at 10:00 AM and PMI composite final (9:45 AM ET) and ISM Services Index (!0 AM ET) both Friday. Fed speakers might begin speaking on Friday as the silent period ends on Thursday.
| Date | Economic Reports |
|---|---|
| Monday, April 29 | 8:30 AM ET: Dallas Fed Manufacturing Survey 11:00 AM ET: Export Inspections 4:00 PM ET: Crop Progress |
| Tuesday, April 30 | 8:00 AM ET: FOMC Meeting Begins 8:30 AM ET: Employment Cost Index 9:00 AM ET: FHFA House Price Index 9:00 AM ET: Case-Shiller Home Price Index 9:45 AM ET: Chicago PMI 10:00 AM ET: Consumer Confidence 3:00 PM ET: Farm Prices 4:30 PM ET: API Weekly Oil Stocks |
| Wednesday, May 1 | 7:00 AM ET: MBA Mortgage Applications 8:15 AM ET: ADP Employment Report 8:30 AM ET: Treasury Refunding Announcement 9:45 AM ET: PMI Manufacturing Final 10:00 AM ET: JOLTS * 10:00 AM ET: ISM Manufacturing Index 10:00 AM ET: Construction Spending 10:30 AM ET: EIA Petroleum Status Report 2:00 PM ET: FOMC Announcement *** 2:30 PM ET: Fed Chair Jerome Powell Press Conference *** 3:00 PM ET: Fats & Oils 3:00 PM ET: Grain Crushings |
| Thursday, May 2 | 7:00 AM ET: Motor Vehicle Sales 7:30 AM ET: Challenger Job-Cut Report 8:30 AM ET: Jobless Claims * 8:30 AM ET: International Trade in Goods and Services 8:30 AM ET: Productivity and Costs 8:30 AM ET: Export Sales 10:00 AM ET: Factory Orders 10:30 AM ET: EIA Natural Gas Report 4:30 PM ET: Fed Balance Sheet |
| Friday, May 3 | 8:30 AM ET: Employment Situation *** 9:45 AM ET: PMI Composite Final 10:00 AM ET: ISM Services Index 1:00 PM ET: Baker Hughes Rig Count |
*** Market Moving Indicators
* Merit Extra Attention
Daily Futures Market Prep and Analysis With the Pros
Interact with our experts and other futures traders during daily livestreams as we analyze the markets in real time and explore our award-winning desktop platform. Log in here.
Trade Futures With Us
Sign up for your free NinjaTrader account today to start your 14-day trial of live simulated futures trading.