Operations > Strategy Analyzer > Monte Carlo Simulation >

Running a Monte Carlo Simulation

Print this Topic Previous pageReturn to chapter overviewNext page

The following page covers how to set up and run NinjaTrader's Monte Carlo Simulation


tog_minusUnderstanding Monte Carlo simulation

What is Monte Carlo Simulation?

Monte Carlo Simulation is a mathematical technique that uses repeated random sampling to compute a range of possible results with their respective probability. NinjaTrader runs Monte Carlo Simulation by randomly combining the trade results in a defined series of simulations. A graph of the results are plotted with the statistic values or Profit/Loss on the Y - axis and the probability on the X - axis as a percentage.


Why use Monte Carlo Simulation?

Although a backtest of a NinjaScript strategy may produce profitable results, those results may have just been due to good luck. In real life, you may have a string of bad trades that can wipe out the account before the good trades appear, therefore it would be helpful to understand the probability of such a string of bad trades. Monte Carlo Simulation will randomize your trade results over and over again in multiple simulations to provide you with a normal distribution of simulation performance. The trader can use this information to see the top or bottom percent of trades (outliers) that will cause the most variability in the strategy as well as the most statistically probable results.

tog_minusHow to run a Monte Carlo simulation

Monte Carlo Simulation window

To open the Monte Carlo Simulation window:


2.Left mouse click on the Trades tab within any of the reports
3.Right mouse click in the data grid and select the item Monte Carlo Simulation...


Monte_Carlo_Simulation_1


Running a Monte Carlo Simulation

To run a Monte Carlo Simulation:


1.Open the Monte Carlo Simulation window (see sub-section above for how to open)
2.Set desired simulation parameters and press the Generate button.


Monte_Carlo_Simulation_2


Monte Carlo Simulation Parameters

The following parameters are adjustable when running a Monte Carlo Simulation:


Graph

Sets the statistic to generate the report on

Mode

Sets the unit type the results are displayed in

Winning/Losing

Sets the results to show only winners, only loser, or both

Long/Short

Sets the results to show only long trades, only short trades, or both

Remove winning outliers (%)

Removes the top % outliers from the results

Remove losing outliers (%)

Removes the bottom % outliers from the results

# of simulations

Sets the # of simulations to run

# of trades per simulation

Sets the # of trades in each simulation (will default to the # of trades in the Trades tab)

tog_minusUnderstanding the Monte Carlo Simulation report

Monte Carlo Simulation Report

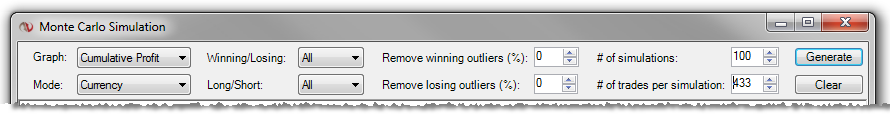
The results of the Monte Carlo Simulation are displayed in a graph below the parameters.
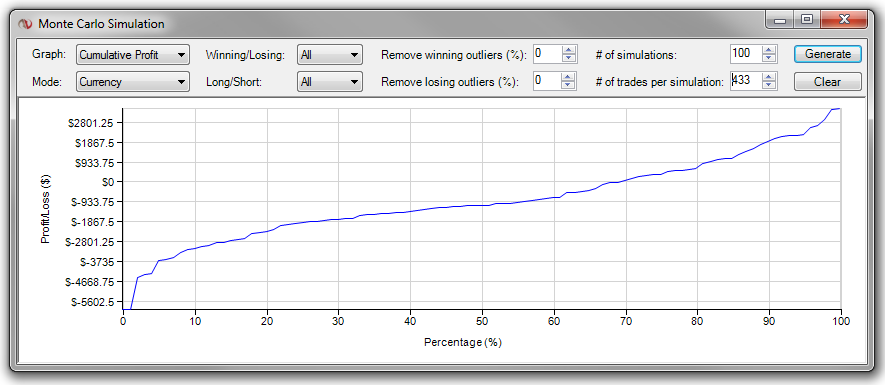
 

Monte_Carlo_Simulation_3


X-Axis

The horizontal axis of the Monte Carlo Simulation graph shows the percentage of simulations that have fallen below the Y - axis value. For example, if you run a Monte Carlo Simulation setting the # of Simulations to "100" and using the Cumulative Profit graph, the intersection of the 50% X - value and the associated Y value means that 50 of your simulations will be below that cumulative profit/loss value, and oppositely the remaining 50 simulations will have a greater cumulative profit/loss. The above screenshot shows an example of a worst case scenario of the strategy losing $5602.50 and a best case scenario with the strategy making $2801.25. This type of report allows you to analyze if the risk/reward ratio between worst and best case scenarios is acceptable or not.


Y-Axis

The vertical axis of the Monte Carlo Simulation graph displays the measured unit for the Graph item selected such as Profit/Loss, statistical information, or time.