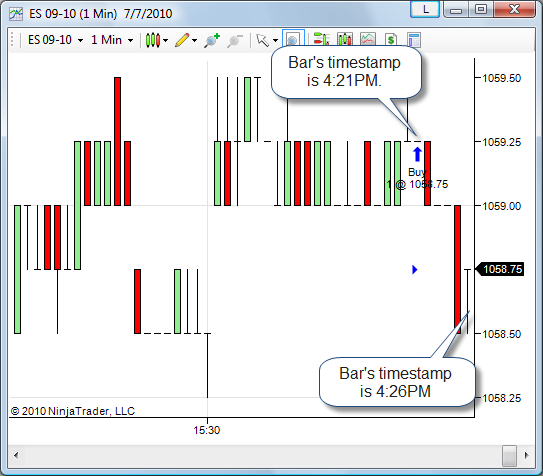
When using a chart with tick based intervals in NinjaTrader it is possible to have several bars with the same timestamp. This usually happens during high volatility times when heavy trading is happening within a very short amount of time. Since there are many bars with the same timestamp, NinjaTrader can only plot the trade execution on the first bar with the same timestamp of the execution since the executions are not tied to specific bars, but tied to specific timestamps. This can appear as if the trade execution occurred with an invalid fill price, but in reality the execution did occur on a valid price, just on a later bar with the same timestamp.
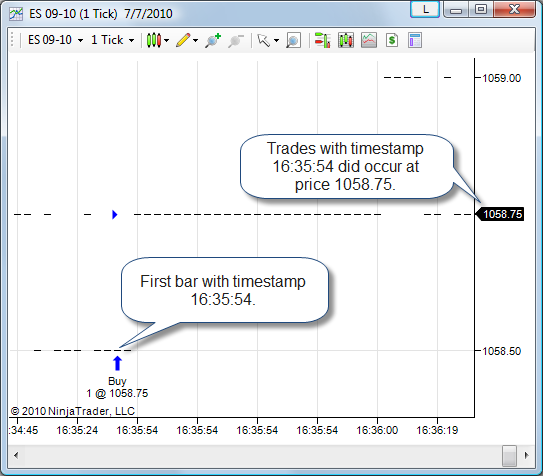
Example: Many ticks occurred on the 16:35:54 timestamp seen in the x-axis below the chart. Trade execution was at price 1058.75 on 16:35:54.
Since the execution occurred on 16:35:54 it is plotted on the first bar with the same timestamp. In this particular case, the first bar was not at the same price as the execution price so it would appear to be filled outside of the bar. Checking bars being plotted later on we find that 1058.75 was a valid price for timestamp 16:35:54 and that this execution was in fact on a valid price.
|