Announcement

Collapse

Looking for a User App or Add-On built by the NinjaTrader community?

Visit NinjaTrader EcoSystem and our free User App Share!

Have a question for the NinjaScript developer community? Open a new thread in our NinjaScript File Sharing Discussion Forum!
See more
See less

Partner 728x90

Collapse

KASE CD and KASE Peak Oscilator

Collapse
X
 
  • Filter
  • Time
  • Show
Clear All
new posts

    KASE CD and KASE Peak Oscilator

    Hello,

    I would like to translate and add in NT 2 indicators called the Kase CD and the Kase Peak Oscilator. Because I'm a novice to translate and create a new indicator, is there anybody who could help me step by step to do that ?

    The formulas below are in Easy Language and are free of copyright

    Thanks a lot for your careful attention

    Angel


    This is below the FREE formulas found on


    .................................................. ..................................................

    Kase Peak Oscillator by Cynthia Case

    Type : Function, Name : StdDevx

    inputs :
    Price(NumericSeries),
    Length(NumericSimple);

    vars :
    SumSqr(0),
    Avg(0),
    Counter(0);

    if Length <> 0
    then begin
    Avg = Average(Price,Length);
    SumSqr = 0;
    for counter = 0 to Length - 1
    begin
    SumSqr = SumSqr + (Price[counter]-Avg) * (Price[counter]-Avg);
    end;
    StdDevX = SquareRoot(SumSqr / (Length-1));
    end
    else
    StdDevX = 0;


    Type : Indicator, Name : Kase Peak Oscillator


    inputs:LEN(30), Smooth(3), Strength(1);
    vars: RWH(0), RWL(0),PEAK(0), MEAN(0), STD(0);

    RWH = (H[0] - L[LEN]) / (AvgTrueRange(LEN) * SquareRoot(LEN));
    RWL = (H[LEN] - L[0]) / (AvgTrueRange(LEN) * SquareRoot(LEN));
    PEAK = WAverage((RWH - RWL),3);
    MEAN = average(PEAK,LEN);
    STD = StdDevx(PEAK,LEN);

    if (MEAN + (1.33 * STD)) > 2.08 then value1 = (MEAN + (1.33 * STD))
    else value1 = 2.08;

    if (MEAN - (1.33 * STD)) < -1.92 then value2 = (MEAN - (1.33 * STD))
    else value2 = -1.92;

    plot1(PEAK,"PeakOsc");
    if PEAK[1] >= 0 and PEAK > 0 then plot2(value1,"+/-97.5%");
    if PEAK[1] <= 0 and PEAK < 0 then plot2(value2,"+/-97.5%");


    .................................................. .....................................


    The free formula of the KCD is :

    Kase CD by Cynthia Case

    Type : Indicator, Name : Kase CD

    inputs:
    LEN(30),
    Smooth(3),
    Strength(1);

    vars:
    RWH(0),
    RWL(0),
    PEAK(0),
    KCD(0);

    RWH = (H[0] - L[LEN]) / (AvgTrueRange(LEN) * SquareRoot(LEN));
    RWL = (H[LEN] - L[0]) / (AvgTrueRange(LEN) * SquareRoot(LEN));

    PEAK = WAverage((RWH - RWL),Smooth);
    KCD = (PEAK) - average(Peak,8);

    plot1(KCD,"KCD");
    plot2(0,"Zero");

    if CheckAlert then begin
    if BullishDivergence(low,plot1,Strength,15) = 1
    then Alert = true;
    if BearishDivergence(high,plot1,Strength,15) = 1
    then Alert = true;
    end;

    #2
    In addition to requesting this from the community...You can also contract a NinjaScript consultant to provide you with a NinjaTrader version.

    List of consultants here - http://www.ninjatrader.com/webnew/pa...injaScript.htm
    RayNinjaTrader Customer Service

    Comment


      #3
      Here's the KaseCD indicator

      Enjoy!
      Attached Files

      Comment


        #4
        Kase CD indicator

        Hello sbgtrading,

        Wonderful, it's very kind of you but this is the first time and I don't really know how to include this indicator in NT.

        I mean should I use the script editor, it's not easy for a novice like me. The tutorial is a big ocean and I'm lost in !!

        Sorry again to bother you with a such stupid thing.

        Thanks for your careful attention

        Best regards

        Angel

        Comment


          #5
          I've completed the combo indicator (KaseCD and Peak Oscillator) and it's attached to this message.

          About importing NinjaScript, there's a couple of steps:

          1) Download the ZIP file to your desktop
          2) Go to Control Center in NinjaTrader
          3) Click on "File" menu item
          4) Mouse over "Utilities" menu item
          5) Click on "Import NinjaScript"
          6) Click "Yes" (if you trust the content)
          7) Find your ZIP file and select it

          Voila!
          Attached Files
          Last edited by sbgtrading; 11-22-2007, 09:29 PM. Reason: Corrected error in SquareWave and added the PeakOsc histogram

          Comment


            #6
            Concerning the Kase Peak oscilator

            Hello again sbgtrading,

            What a very efficient reply you gave me, it's impressive !!!

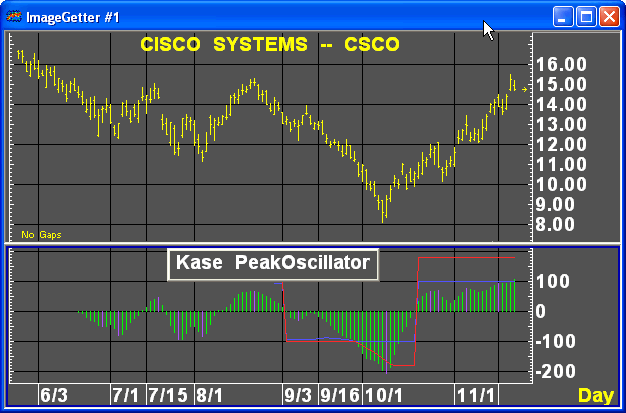
            The Kase CD compiled in the Peak Oscilator runs very well but if you click on the link below you 'll see that there is an histogram in the Peak Oscilator that I can"t find in your combo. In fact the red horizontals/vertical lines is only an overbought/oversold level. If you build all in a combo, on the same indicator, you have to find :
            A) The KCD line/histogram
            B) The Peak Oscilator histogram/line
            C) The Peak Oscilator overbought/oversold level

            The best use is when the KCD and the Peak Osc show TOGETHER and at the same time divergence with prices.


            Thanks for your very careful attention

            Cheers

            Angel

            Comment


              #7
              Concerning the case indicator......

              Hi,

              Just to tell you one more time a big thank.

              I 'm trading DIVERGENCES with prices at confluences or support/resistance levels, that's why I'm looking for a reliable momentum oscilator.

              Now I use a stochastic oscilator because others indicators like RSI, CCI, MACD lag and give me too many false divergence signals too !

              Sincerely

              Angel

              Comment


                #8
                Glad I could help (an) Angel.

                Hmmm...about your missing histogram. It appears to me that you just need to output the KCD line as a "bar", not as a "line".

                Try changing the properties of the KCD line to "bar" and let me know if it fixes the visualization issue.

                Here's the steps:
                1) Go to the Indicator screen from the Chart.
                2) Go down to where you see "KCD", there should be a "+" to the left of it
                3) Click on the "+" sign and that will let you change the "Plot Style".

                Ben

                Comment


                  #9
                  KCD and Peak oscilator.....................

                  Hi,

                  In fact, this is NOT the KCD line that miss, but the Kase Peak Oscilator line !!

                  Try to build the Peak oscilator without the KCD, you'll see that with the overbought/oversold line an histogram appears. In fact if you put each indicator on a different panel, you'll see that each get it's line/histogram.

                  Let me give you the link for the Kase Peak oscilator screen ALONE : I mean this is NOT the combo screen, KCD+Peak Oscilator !!!


                  Thanks

                  Sincerely

                  Angel

                  Comment


                    #10
                    Hi Angel,

                    I found the problem and corrected it! Please download the new indicator (as attached to Post #5 in this thread).

                    Thanks and I wish you all the best!

                    Ben

                    Comment


                      #11
                      The KCD/Peak oscilator combo update......

                      Bonjour Ben,

                      What a fantastic job you did, evevrything is running well !!!

                      Sincerely, I don't find any words to express my gratitude and what a beautiful gift you give me.

                      Once again, thanks for all

                      I wish you a pleasant thanksgiving

                      God bless you and your family

                      Best regards

                      Angel

                      Comment


                        #12
                        Well, it's been 24 years since I sat in my high school French class, but I do remember: "Je parle en peu le francais" and "ou est la toilette?"

                        Thank you for the blessings, now go out and make beaucoup francs with that indicator!

                        Bon chance,

                        Ben

                        Comment


                          #13
                          Hello my friend,

                          24 years, it's like it was yesterday !!

                          As an Angel, I don't care about time but as time is money, I try to take care about muy French* wallet

                          Having said that, your contribution on this board is huge, very huge and all for free. So kind people we can find on this board, Raymond, John, eamon the Irish, you and others.... The NT community is growing and growing fastly .........

                          Seriously, what can I ask you more ? May be this thing, old momentum indicators like MACD, stoch, RSI, CCI...etc are out to date so can you build a new momentum indicator specialized in CLASSIC/HIDDEN divergences detection on multiple time frame with an alert when a divergence on multiples time frame appears and a swing high/low is exceeded on my main 3 Min chart ?

                          It's a joke, I'm kidding :-)

                          Okay, I don't want to bother you one more time

                          Have a good day

                          Bon weekend

                          Sincerely

                          Angel


                          *Not easy to improve my English knowledge, unfortunatly I speak English like a Spanish cow

                          Comment


                            #14
                            Now that was funny...you had me hook, line and sinker on that IMPOSSIBLE indicator (I sure am glad you were kidding!)

                            Thanks for the laugh,

                            Ben

                            Comment


                              #15
                              This is a great indicator!

                              I'm reading Kase's book "Trading With the Odds" at the moment and I'm HIGHLY impressed. She makes many good points.

                              This is 2008, why the **** are so many of us relaying indicators that were designed to plotted with hand-held calculators in the 1970's??? How many of the indicators we all use were designed prior to the advent of the personal computer?

                              With that in mind, one thing I noticed was missing from this indicator is the different color bar for the peak (purple bar in this screenshot)


                              Arguably one of Kase's greatest contributions was in using 'synthetic bars'. i.e. Instead of having to wait until the end of the week to update a weekly bar, form a 'synthetic' bar from the last 5 days. That way your weekly bars are always up to date. The same can apply to daily bars, or hourly bars (create synthetic hourly bars from the previous four 15 minute bars etc.)

                              FORMING SYNTHETIC BARS
                              1. n = number of bars to merge, e.g., n = 5 to convert a
                              daily into a weekly synthetic bar

                              2. Synthetic high = max (H 101 to H [n. - 11 1;
                              The maximum high of bars [Ol, [ll, [21, 131, and [41.

                              3. Synthetic low = min ( L [Ol to L [n - 11 1;
                              The minimum low of bars [O], [l], [2], [3], and [4].

                              4. Synthetic open = open [n - 11;
                              The open five days back would be the open of bar [41.

                              5. Synthetic close = close [Ol ;
                              The close of n bars would be the close of bar [Ol or the
                              most current bar.

                              6. Synthetic previous close = close ml;
                              The close of the previous segment would be the close of
                              bar 151 or the close six days back.

                              7. Number of bars for total length of longer term
                              indicators = x x n (where .X is the length or periodicity
                              of the longer term indicator).
                              For example, to get nine weekly bars, x = 9. Then:
                              x x n = 9 x 5 = 45 bars.

                              8. For number of bars back, 1x1 is changed to LX x nl + 1,
                              where z = any periodicity input into the indicator.
                              As with item 7, above, the number of bars back to
                              count would be (9 x 5) + 1 = 46 bars.

                              The values above in any normal formula for indicators
                              are substituted and smoothed as necessary
                              In this example, n is the number of bars to merge. If
                              n = 5, this creates a weekly synthetic bar from daily information.

                              If a 15-minute bar is converted into an hourly
                              bar, n would be set to equal 4. If there are five hours in
                              day and the trader wishes to convert an hourly chart into
                              a weekly chart, n = 25 would be used and so on. Synthetic
                              high is simply the maximum of the high from bar
                              zero to bar [n - 11. Thus, if rz = 5, the trader is counting
                              from bar zero to bar four.

                              The Synthetic low is similarly calculated as the minimum
                              of this range. The synthetic open is the open of bar
                              [n - 11, and the synthetic close is the close of the current
                              bar or bar [O]. With this procedure, the close of the previous
                              bar is not close 111, as it would be with normal bars,
                              but close Ln]. In this example, converting daily bar information into a weekly bar, the synthetic previous close is
                              the close of the sixth bar back.
                              I'm wondering if anyone might be able to code a Kase Stochastic?


                              Here is the overview:

                              THE KASE PERMISSION STOCHASTIC:
                              A BETTER SCREEN
                              Figure 4-6 illustrates the same natural gas daily data series as Figure 4-4, but this time it is accompanied by the weekly Stochastic and the Kase Permission Stochastic.
                              Kase Permission Stochastic Filters While there appears to be more noise on the Kase Permission Stochastic,
                              in a general sense, the two charts look relatively similar.
                              The permission-K and the permission-D in the Kase Permission Stochastic, parallel the %K and %D in the traditional Stochastic; the two charts tend to fluctuate together. The Kase Permission Stochastic, though “noisier,” has fewer whipsaw crossovers than the traditional,
                              longer time-frame slow Stochastic. Indeed, research indicates that the number of whipsaws are generally reduced by about 80 percent using the Kase Permission Stochastic. If the time around the middle of December, 1993 is carefully examined, a whipsaw crossover will be noted in the regular weekly Stochastic, while the Kase Permission Stochastic does not cross.

                              My research also indicates that the Kase Permission Stochastic crosses ahead of a normal longer time-frame Stochastic more than 80 percent of the time and usually leads by one or two days. Careful examination of Figure 4-7 demonstrates that in June the Kase Permission Stochastic crossed unusually early (13 days ahead of the normal Stochastic). This occurred because of an unusually high number of whipsaws, noted earlier in a normal Stochastic. In
                              this case, a normal Stochastic whipsawed up and down a number of times prior to crossing to the downside, while the Kase Permission Stochastic simply generated a normal ci-ossover signal, Figure 47 shows the same contract, first nearby natural gas, with more recent data and similar results.
                              Last edited by Elliott Wave; 05-12-2008, 01:09 PM.

                              Comment

                              Latest Posts

                              Collapse

                              Topics Statistics Last Post
                              Started by TheWhiteDragon, 01-21-2019, 12:44 PM
                              4 responses
                              541 views
                              0 likes
                              Last Post PaulMohn  
                              Started by GLFX005, Today, 03:23 AM
                              0 responses
                              3 views
                              0 likes
                              Last Post GLFX005
                              by GLFX005
                               
                              Started by XXtrader, Yesterday, 11:30 PM
                              2 responses
                              11 views
                              0 likes
                              Last Post XXtrader  
                              Started by Waxavi, Today, 02:10 AM
                              0 responses
                              7 views
                              0 likes
                              Last Post Waxavi
                              by Waxavi
                               
                              Started by TradeForge, Today, 02:09 AM
                              0 responses
                              14 views
                              0 likes
                              Last Post TradeForge  
                              Working...
                              X