
In this week’s coverage, we analyze the pullback in the Russell 2000 and the rallies in the copper and Euro Forex futures markets, and the consolidation in the natural gas futures chart. We also examine the economic reports and earnings announcements expected next week.
Commentary and charts reflect data at the time of writing. Market conditions are subject to change and may not reflect all market activity.
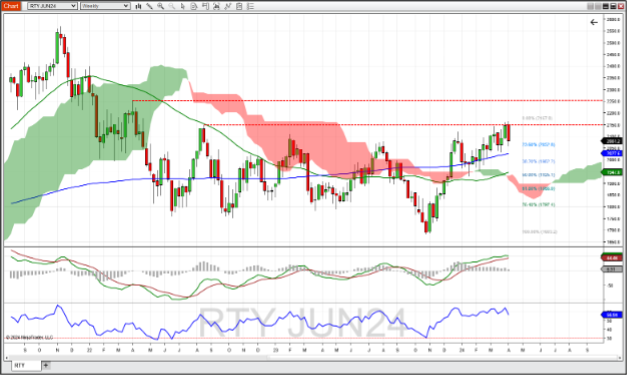
June E-Mini Russell 2000 Index Futures Daily Chart
June E-mini Russell 2000 Index futures pulled back last week, forming a bearish engulfing candlestick pattern (wherein the body of last week’s candle engulfs the previous week’s candle, and may imply a reversal to the downside). This after finding resistance at the 2,150 level, which was a previous high level back in August 2022 on an adjusted-data basis. This reversal has brought the MACD closer to its signal line, showing a bit of weakness in momentum during this bounce off the 200-week moving average. RSI is trading in line with price. Should this reversal continue, support might be found at the 52-week moving average (~2,027) and further down at the 38.2% Fibonacci retracement level (1,982). A continuation of this year’s uptrend might find resistance again at 2,150 and further up at ~2,250 (coincident with the April 2022 high).
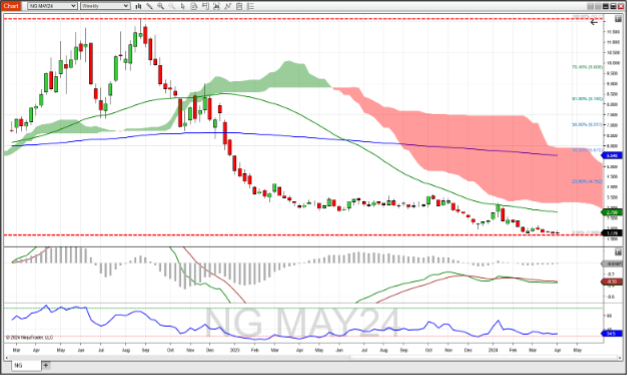
May Natural Gas Futures Daily Chart
May natural gas futures finished the week two cents higher but still at long-time lows around 1.775. This places nat gas well under the 52-week and 200-week moving averages, and under the Ichimoku cloud, too. The MACD study remains negative, although it is poised to cross above its signal line (as reflected in the upward-sloping histogram that is about to cross above zero). RSI is at 34.5, which is not yet oversold but might be showing slight bullish divergence as the RSI troughs are higher while price trends slightly lower. If this market should reverse, the first major obstacle to overcome would be the 52-week moving average (~2.79). After that, a break into the Ichimoku cloud could find resistance at the 38.2% retracement level of the downtrend which started in August 2022 (5.678). Support might be found at the psychological level of 1.50.
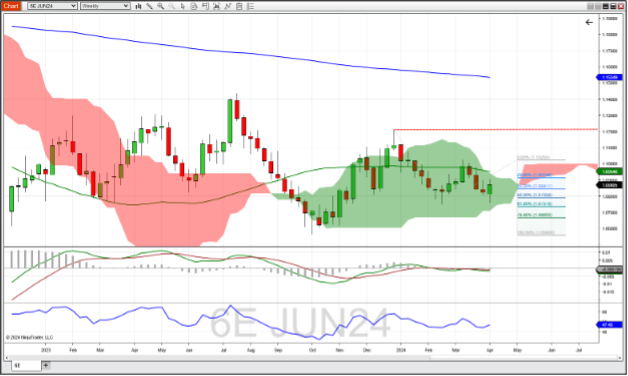
June Euro Forex Futures Weekly Chart
June Euro Forex pound futures remain trapped in the Ichimoku cloud as it has been since entering from above in September of last year. Part of this could be due to the ability of the 200-week moving average to hold this market down (acting as resistance). A possible bullish reversal signal in the form of a bullish engulfing candlestick pattern was completed last week. As is usual with consolidating markets, the MACD is tangled up with its signal line (giving no great indication of a directional change in price) and the RSI flaps in the wind around the 50 level. If this market continues its downtrend, support might be found at the 61.8 Fibonacci extension level (~1.0738) and further down at the 76.4% Fib level (~1.067). A break above the Ichimoku cloud and 200-week moving average could target the previous peak high at ~1.12.
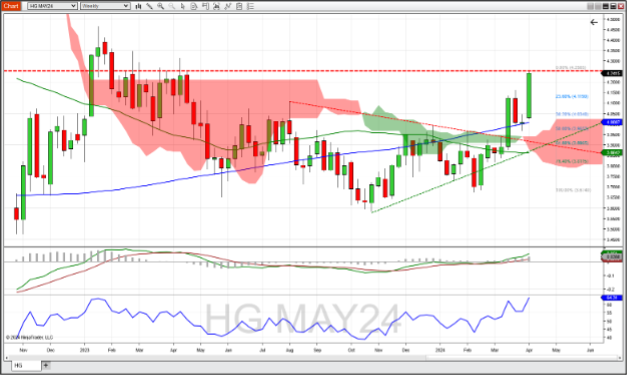
May Copper Futures Weekly Chart
May copper futures finished the week with another dominant bullish candle, with a launch of the 200-week moving average (which was tested and held as support after copper crossed above it a month ago). That break out also pushed copper out of a wedge formation in a decisive manner and propelled it above the Ichimoku cloud. Looking left we see that copper tested a level of resistance from much of the early part of 2023. The MACD also got a lift with the breakout one month ago, with both the MACD line and the histogram turning positive. The RSI at 64+ is nearing overbought territory, which could mean that this uptrend in price has room to run. If that is the case, look for possible resistance at the highs from early 2023 (~4.4665). A reversal to the downside could see support at the 23.6% Fibonacci retracement level (~4.120) and further down at the 38.2% Fib level, which may coincide with the 200-week moving average (~4.035).
Companies Reporting Earnings April 8 – April 12
A light week for earnings with insights into the Travel & Leisure space with Delta Air Lines reporting on Wednesday morning, and the automobile marketplace represented by CarMax (reporting Thursday morning). Friday morning will bring reports from six companies with over $100 billion in revenue–all in the financial space.
These reports will most likely have economic outlooks for 2024, which could make some news. JPMorgan Chase is in the Dow Jones Index, so YM/MYM futures might see some volatility if JPM reports something different than expected. This is an early beginning to earnings season for the first quarter of 2024.
| Date | Companies Earnings |
|---|---|
| Monday, April 8 | N/A |
| Tuesday, April 9 | N/A |
| Wednesday, April 10 | Delta Air Lines, Inc. (DAL): $0.34 EPS Estimate, $12.88B Revenue Estimate (BMO) |
| Thursday, April 11 | N/A |
| Friday, April 12 | JPMorgan Chase & Co. (JPM): $4.22 EPS Estimate, $40.78B Revenue Estimate (BMO) * Wells Fargo & Co. (WFC): $1.09 EPS Estimate, $20.17B Revenue Estimate (BMO) Blackrock, Inc. (BLK): $9.24 EPS Estimate, $4.65B Revenue Estimate (BMO) Citigroup, Inc. (C): $1.41 EPS Estimate, $20.29B Revenue Estimate (BMO) Progressive Corp. (PGR): $2.96 EPS Estimate, $16.50B Revenue Estimate (BMO) State Street Corp. (STT): $1.54 EPS Estimate, $3.05B Revenue Estimate (BMO) |
* indicates that this company is in the Dow Jones Index
Economic Reports for the week of April 8 – April 12
This week starts slowly, with a couple of weekly reports from the USDA on Monday and NFIB Small Business Optimism early Tuesday morning. The Consumer Price Index (CPI) on Wednesday 8:30 AM ET could bring some market-moving news, especially if it comes in higher than the forecast number of 3.4% (which would be a tick up inflation from the previous month’s 3.2%).
Other newsworthy mention reports that day are the weekly EIA Petroleum Inventory report (especially after the announcement that the SPR replenishment plans are on hold), as well as the FOMC minutes for the March FOMC meeting, which could give clarity to the FOMC members’ reasoning behind recent and upcoming rate decisions.
Thursday morning sees the usual Jobless Claims (forecast to dip slightly with 217,000 jobless claims) coupled with the Producers Price Index (PPI), which is forecast to have increased 0.3% month over month. The monthly World Agriculture Supply Demand Estimates are published at noon ET Thursday, which could move such agriculture markets as corn, wheat, cotton, and soybeans.
Also on Thursday, the 30-Year Bond auction at 1 PM could have clues as to what the treasury market thinks about the economy. Throw in a couple of Fed speakers (Raphael Bostic and John Williams) and you might see a very volatile trading day in all asset classes. The Consumer Sentiment report from University of Michigan at 10 AM ET on Friday could be a market mover. The week finishes with two fed speakers–Raphael Bostic and Mary Daly, both in the afternoon.
| Date | Economic Reports |
|---|---|
| Monday, April 8 | 11:00 AM ET. Export Inspections 4:00 PM ET, Crop Progress 7:00 PM ET, Minneapolis Fed Reserve Bank President Neel Kashkari Speaks |
| Tuesday, April 9 | 6:00 AM ET: NFIB Small Business Optimism Index 1:00 PM ET: 3-Year Note Auction 4:30 PM ET: API Weekly Oil Stocks |
| Wednesday, April 10 | 7:00 AM ET: MBA Mortgage Applications 7:00 AM ET: Bank Reserve Settlement 8:30 AM ET: CPI *** 10:00 AM ET: Wholesale Inventories (Preliminary) 10:30 AM ET: EIA Petroleum Status Report * 12:45 PM ET: Chicago Fed Bank President Austan Goolsbee Speaks 1:00 PM ET: 10-Year Note Auction * 2:00 PM ET: FOMC Minutes * 2:00 PM ET: Treasury Statement |
| Thursday, April 11 | 8:30 AM ET: Jobless Claims *** 8:30 AM ET: PPI-Final Demand *** 8:30 AM ET: Export Sales 8:45 AM ET: New York Fed Bank President John Williams Speaks 10:30 AM ET: EIA Natural Gas Report * 12:00 PM ET: USDA Supply Demand - Corn, Wheat, Soybean, Cotton *** 12:00 PM ET: Crop Production 1:00 PM ET: 30-Year Note Auction * 1:30 PM ET: Atlanta Fed Bank President Raphael Bostic Speaks @AtlantaFed 4:30 PM ET: Fed Balance Sheet |
| Friday, April 12 | 8:30 AM ET: Import and Export Prices 10:00 AM ET: Consumer Sentiment * 1:00 PM ET: Baker Hughes Rig Count 2:30 PM ET: Atlanta Fed Bank President Raphael Bostic Speaks 3:30 PM ET: San Francisco Fed Bank President Mary Daly Speaks |
*** Market Moving Indicators
* Merit Extra Attention
Daily Futures Market Prep and Analysis With the Pros
Interact with our experts and other futures traders during daily livestreams as we analyze the markets in real time and explore our award-winning desktop platform. Log in here.
Trade Futures With Us
Sign up for your free NinjaTrader account today to start your 14-day trial of live simulated futures trading.