As one of the most popular and widely traded futures markets, the E-mini S&P Index offers traders the ability to speculate on the aggregate performance of the 500 largest stocks listed on U.S. exchanges. This broad market exposure provides a simple, direct, and cost-effective way to trade stock market trends, with many additional benefits over individual stocks and ETFs.
Watch a brief video on the E-mini S&P 500 Index:
In this article, we’ll walk through a fundamental analysis of E-mini S&P 500 Index futures, explore the many factors that can influence and shape long- and short-term market price action, and review how understanding these factors can help you make better, more informed trading decisions. We’ll also examine:
- What factors can drive the price of E-mini S&P Index futures?
- What is the historical seasonal pattern of E-mini S&P Index futures?
- What are the intermarket relationships with E-mini S&P Index futures?
- Who are the big traders in E-mini S&P Index futures?
What does the E-mini S&P Futures Market Represent?
The E-mini S&P futures market is a critical global trading instrument representing a broad cross section of the U.S. economy. By trading S&P 500 futures, international traders can gain instant direct exposure to the U.S. stock market performance without investing directly in a large portfolio of U.S. stocks, which can have foreign currency exchange risk.
What Can Affect the Price of E-mini S&P Index Futures?
Like most financial investment products, economic indicators are important fundamental factors that can influence the price of E-mini S&P Index futures. Likewise, international monetary policy and geopolitical events and conflicts can cause uncertainty, affecting investor sentiment.
These factors are often interconnected and can sometimes amplify effects on each other and the stock market concurrently. Let’s review how they can affect E-mini S&P futures.
Economic Indicators
Daily economic data often has a direct, immediate impact on investor sentiment. It can cause significant price fluctuations in the futures markets as traders position themselves for short-term, midterm, and long-term investment outlooks. Key reports traders should follow include gross domestic product (GDP), inflation, and U.S. employment.
U.S. Dollar (USD)
The USD plays a significant and sometimes complex role in the pricing of E-mini S&P futures. A strong USD can negatively affect the earnings of companies with substantial international operations; when the USD is strong, revenues earned in foreign currencies are worth fewer dollars when converted back. Also, many commodities are priced in USD, making them more expensive, which can increase costs and reduce profits.
Geopolitical and Geoeconomic Factors
Geopolitical and geoeconomic factors can increase risk and affect investor sentiment, which can drive the price of E-mini S&P futures lower. These factors include energy supply disruptions, political instability, trade policy changes, and international conflicts.
To learn more, join NinjaTrader’s daily livestream events, where we discuss economic reports and factors with expert commentary and analysis.
Intermarket Analysis of E-mini S&P Index Futures
Intermarket relationships refer to the connections and correlations between different futures markets. Understanding these relationships can provide valuable insights for traders when formulating a directional bias for a specific market. For S&P 500 E-mini futures, there are several key intermarket relationships to watch.
Bonds and Interest Rates
Typically, when bond prices rise (and interest rates fall), it can be positive for the stock market as lower interest rate yields make stock buying more appealing to investors. In addition, lower interest rates (borrowing costs) can help companies expand and boost corporate profits.
Conversely, rising interest rates (falling bond prices) can make fixed income investments more attractive by creating less demand for stocks, and higher borrowing costs can depress corporate earnings due to lower consumer spending. The relationship between the 10-year Treasury yield and the S&P 500 is something traders should always watch.
Volatility Index (VIX)
The VIX measures expected stock market volatility based on the implied volatility of S&P 500 Index options. Often referred to as the "fear gauge," a rising VIX often corresponds with falling S&P 500 prices and indicates increasing uncertainty or fear in the market. Falling volatility prices typically correspond to rising index futures prices as market makers and traders anticipate less risk (Figure 1).
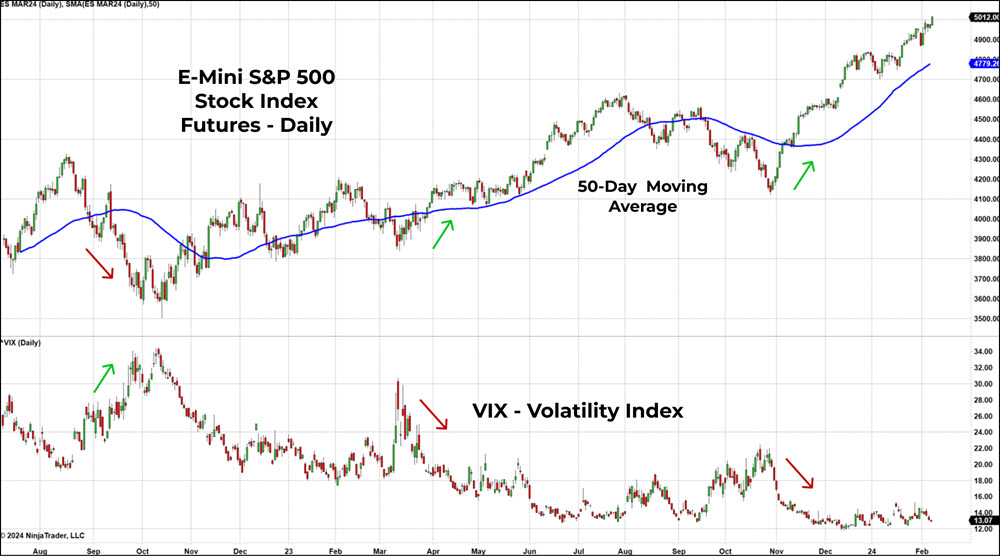 Figure 1: E-mini S&P 500 futures daily chart with the Volatility Index (VIX).
Blue line = 50-day simple moving average, showing the midterm price fluctuation of E-mini S&P 500 futures driven by market fundamentals, economic news, and geopolitical events.
Red and green arrows = highlight the opposite correlation between stock prices and volatility
Seasonality Patterns of E-mini S&P 500 Index Futures
Seasonality is the analysis of historical price patterns throughout the year. The current E-mini S&P futures seasonality 15-year pattern (in black below) typically sees higher prices from the end of January through the end of April, then lower prices through the end of June. Prices tend to rally in July, with lower prices typically seen in August and September, then higher prices staying through the rest of the year. (Figure 2)
It is important to note that seasonality is a general guideline for possible trends and not a measure of magnitude. Trends can vary significantly from year to year.
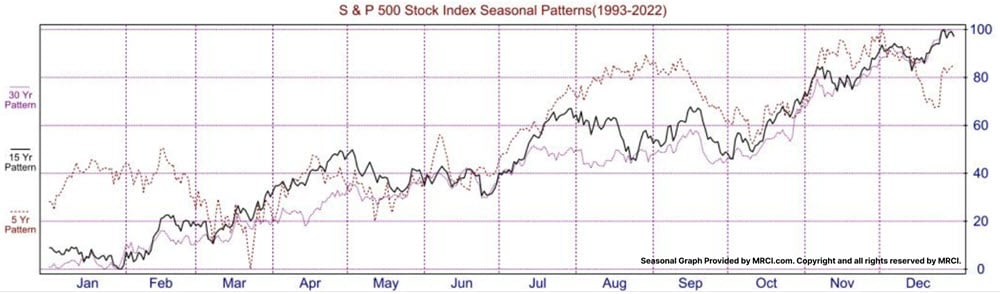 Figure 2: E-mini S&P 500 futures seasonality patterns for 5, 15 (in black), and 30 years of historical data.
CFTC Commitment of Traders (COT) Report for E-mini S&P Index Futures
The Commodity Futures Trading Commission (CFTC) requires all large traders to report their open futures positions every week, which the CFTC then publishes in the COT report. Below is the COT indicator and data for E-mini S&P Index futures available on the NinjaTrader platform, which shows the net position for each group of traders (Figure 3). Read more about what the COT report is here.
Typically, the commercial traders (in blue below) are both hedging and speculating on the price of E-mini S&P futures to better control risk and lock in profits on both long and short positions. When commercial traders get more net short, prices tend to rise; when they get more net long, prices tend to fall.
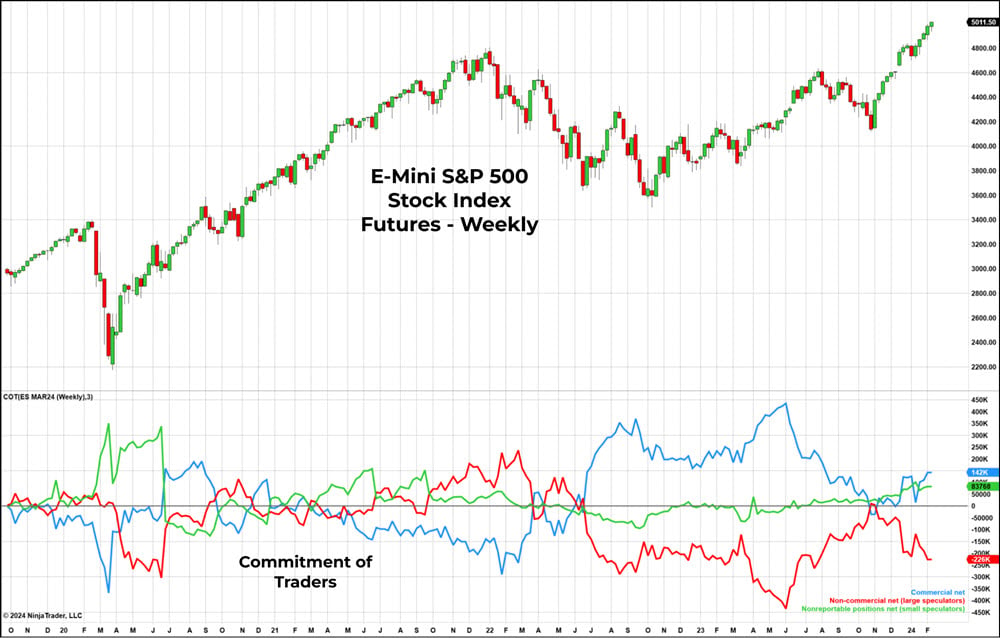 Figure 3: COT net positions report for E-mini S&P index futures. Readings above 0 = net long and below 0 = net short.
Red line = Net large speculators
Blue line = Net commercial traders
Green line = Net non-reporting positions
What Affects the Intraday Price of E-mini S&P Futures?
The intraday price of E-mini S&P futures can fluctuate greatly based on news reports, trader sentiment, and the fundamental factors noted above. But in today's uniquely dynamic futures markets, it’s also important to consider the influence that technology has on stock market prices. Algorithmic trading is becoming a significant portion of trading volume, which can see many trades occur in a short period of time, moving the market and increasing volatility.
Using Technical Analysis to Trade E-mini S&P 500 Futures
In addition to fundamental analysis, most traders also use technical analysis to help determine entry and exit points. Technical indicators can be used on price charts to help analyze price trends and identify chart patterns and key trading levels.
There are several futures-centric indicators popular with traders, including Floor Trader Pivots, Commodity Channel Index (CCI), Ichimoku Cloud, and NinjaTrader Order Flow Volume Profile. Indicators like moving averages and trendlines can help determine trend direction, while indicators like Stochastic and Bollinger Bands can help traders identify reversals in the trend.
Take Your Futures Trading to the Next Level With These E-mini S&P Futures Analysis Skills
We’ve covered a fundamental analysis of E-mini S&P Index futures, which are available as both standard and micro-sized contracts. Every trader has their own approach to market analysis, combining both fundamental and technical analysis into a trading plan to help make more consistent trading decisions.
E-mini S&P futures, like many futures markets, are often news-driven, especially intraday as market trends can turn on a dime. When key economic reports are scheduled to be released, it’s important to be more diligent with open positions and watch over your orders and positions with more aggressive risk management. Determining when to get in and out of an E-mini S&P futures position is only part of a comprehensive trading plan that includes trade sizing, risk management, and setting goals and objectives for your overall trading.
Unlock Free Exclusive Training
Explore the foundational concepts of fundamental and technical analysis with our free multi-video trading course “Technical Analysis Made Easy.” Learn how to analyze and anticipate market movements using market prices, volume data, and more.
Start Trading With NinjaTrader
Still haven’t signed up for your free NinjaTrader account? Get started today with a 14-day trial of live simulated futures trading.